| Hitachi Deskstar 7K500 500GB SATA-II Hard Drive - Page 3 of 4 |
Testing Results:
HD Tach 3.0.1.0 (Short Test):
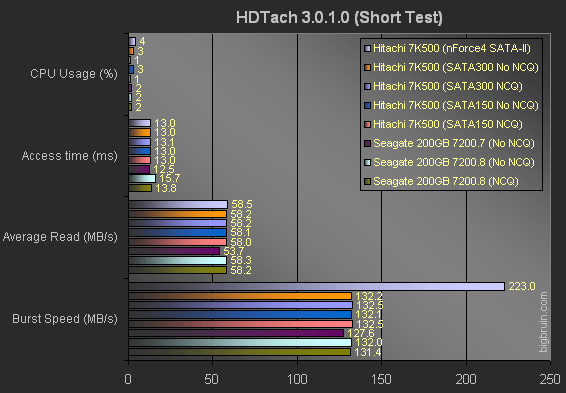
HD Tach is a benchmark focused on hard drive performance, and its dedicated nature makes it particularly easy to use. It provides key information regarding the drive being tested, and the chart below details the reported CPU usage while testing, the access time, the average read speed, and the burst (maximum) speed.
This round of testing involved a unique step just to see what we could achieve. An nForce4 system (AMD Athlon 64 3200+ and DFI LANParty UT nF4 Ultra-D motherboard) with SATA-II capabilities not restricted by the PCI bus was used to see how fast it could really go. Time with this system was limited, so we blasted through some HD Tach tests and added them to our results.

Lower values are desirable for CPU usage and access time, while higher values are better for average read speed and burst speed. The most interesting results are those found in the burst speed category. The results from the 7K500 while in SATA150 or SATA300 mode beat the competition by a decent margin, but drop the drive into an nForce4 system and the speed is incredible. The single drive performance rivals any high-end RAID 0 array I have seen, and I can only imagine what a pair of SATA300 drives in RAID 0 could do.
The access times were consistent in all modes of operation on the Hitachi 7K500 drive, and slightly better than the 7200.8 drive from Seagate. The CPU usage data provides some interesting information, as the usage doubled when going from the base test system to the nForce4 system.
SiSoft Sandra 2005 (File System Benchmark):
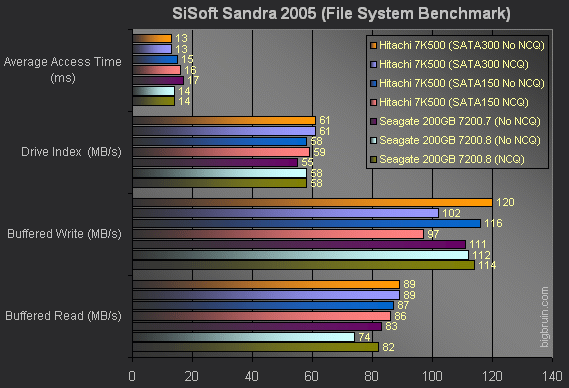
The results charted below are taken from SiSoft Sandra 2005's File System Benchmark. This benchmark provides several results, and a few were selected to represent the performance of each drive configuration. The "Buffered Read" and "Buffered Write" values were chosen since the next benchmark (PC Wizard 2005) also uses these values and it may be of interest to compare the two sets of results. The "Drive Index" is an overall assessment of the drive's performance, and the "Average Access Time" is this benchmark's assessment of that specification.

Lower values are desirable for the average access time, while higher values are better for buffered read, buffered write, and burst speed. Switching the drive between SATA150 and SATA300 modes, as well as switching NCQ support on/off through the controller did not provide results as dramatic as we saw in the burst speed results from HD Tach. We can see a decent performance boost when enabling NCQ and SATA300, but I guess I was expecting to see results that were much higher. The drives may be able to support the higher speeds, but the system might not, especially with slower drives running the operating system and benchmark applications. A second SATA300 drive (as a system disk) would make things a bit more interesting, and would probably provide better results
The one area where results seemed way off is the buffered write performance in SATA150 or SATA300 mode with NCQ enabled. The results lag well behind the same drive with NCQ disabled, as well as the results put up by the other test drives. These tests were repeated to confirm this, and in one of the tests, the values were even less (the 102 MB/s value for buffered write was actually 92 MB/s in one test).
PC Wizard 2005 (Hard Disk Benchmark):
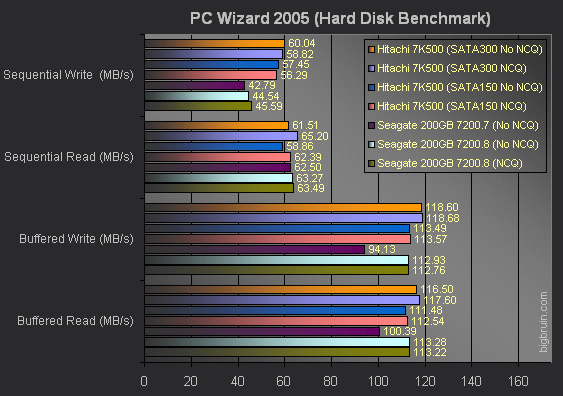
PC Wizard is a lesser known suite of hardware/system information and benchmarking modules that can quickly provide some helpful information about your computer's hardware. The hard disk benchmark module provides a quick test on a drive's sequential read, sequential write, buffered read, and buffered write capabilities. The chart below summarizes the details of this round of testing.

Higher values are better in all values from PC Wizard 2005. The results here follow the trend set by the other two benchmarks, with the Hitachi 7K500 generally doing better than the competition in SATA150 modes, as well as doing much better in SATA300 mode. The extra cache memory comes into play with the slight performance boost at the same speeds, and would help real world applications greatly.
Speaking of real world applications, you will notice the test results do not report any. With only one SATA300 drive on hand, the system drives greatly limit the performance that could be seen in reading/writing tests, and we would really just be detailing the capabilities of the SATA150 drives.
Please read on to the next page for more... Next
Page 1 | Page 2 | Page 3 | Page 4 | Home | Forum | Review Index
|
|
|
|