| Seagate Barracuda 7200.8 200GB Hard Disk Drive - Page 4 of 6 |
Testing Results (continued):
SiSoft Sandra 2005 (File System Benchmark):
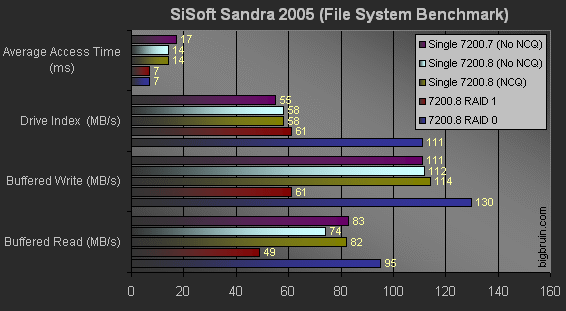
The results charted below are taken from SiSoft Sandra 2005's File System Benchmark. This benchmark provides several results, and a few were selected to represent the performance of each drive configuration. The "Buffered Read" and "Buffered Write" values were chosen since the next benchmark (PC Wizard 2005) also uses these values and it may be of interest to compare the two sets of results. The "Drive Index" is an overall assessment of the drive's performance, and the "Average Access Time" is this benchmark's assessment of that specification.

Lower values are desirable for the average access time, while higher values are better for buffered read, buffered write, and burst speed. Overall the results from SiSoft Sandra are in line with what we first saw in HD Tach, and show the 7200.7 and 7200.8 drives performing similarly, with a slight edge in most tests going to the latest generation from Seagate (7200.8). The largest disparity comes from the average access time results, where this test indicates the newer drives are three milliseconds quicker, and that either configuration of RAID cuts that time in half.
Enabling NCQ provides a minor increase in performance on the buffered read and write portions of the test, but as with HD Tach, nothing overwhelming.
PC Wizard 2005 (Hard Disk Benchmark):
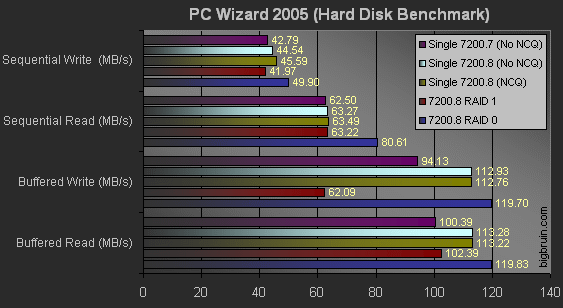
PC Wizard is a lesser known suite of hardware/system information and benchmarking modules that can quickly provide some helpful information about your computer's hardware. The hard disk benchmark module provides a quick test on a drive's sequential read, sequential write, buffered read, and buffered write capabilities. The chart below summarizes the details of this round of testing.

Higher values are better in all values from PC Wizard 2005. The results from this test follow the pattern established by the first two tests... The 7200.8 results show a performance increase over the 7200.7 results, while enabling NCQ does nothing to improve performance. The one interesting aspect of this round of testing is that the RAID 0 results really don't shine as well as they did in other tests.
Please read on to the next page for more... Next
Page 1 | Page 2 | Page 3 | Page 4 | Page 5 | Page 6 | Home | Forum | Review Index
|
|
|
|