Testing (continued):
Performance Test 7.0:
PassMark offers a suite of tests intended to provide an overview of a system's performance, with results provided for all of the key subsystems. Performance Test 7's complete package was executed, and the results are shown for the overall PassMark rating, as well as the rating for each individual component. The units of measure are "Marks", a relative value PassMark implements, and higher is better for all tests.
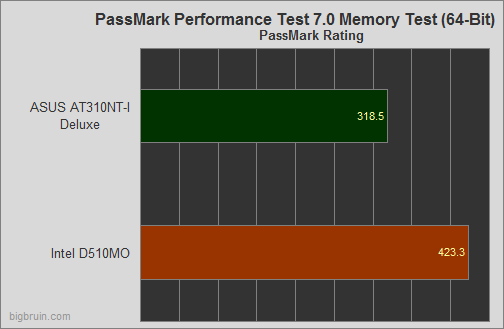
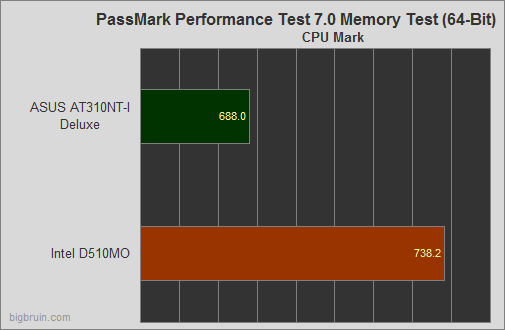
The first charts we see are the overall PassMark and the CPU Mark scores. The Atom 330 processor just can't hang with the newer technology of the Atom D510 and it shows here as the D510 is about 7% faster.
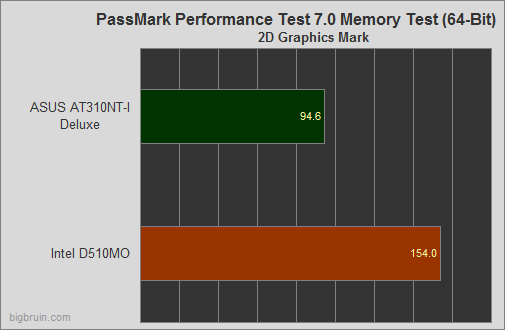
Next we move to graphics performance with the 2D and 3D portion of the benchmark. Surprisingly here, the Intel solution on the D510MO beats the 9400M nVidia solution by over 60% in 2D. We ended up running these test numerous times just to be certain.
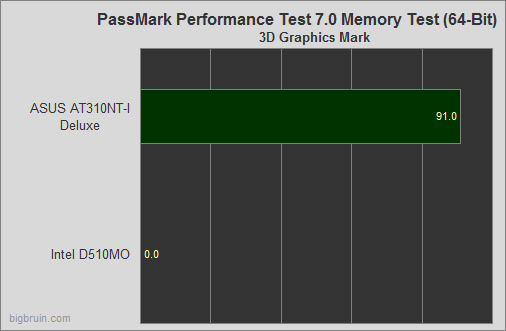
In the 3D test, the Intel board failed to produce a result and greeted us with an error box on that particular portion of the benchmark every time. Chalk up the easy 3D win for ASUS here.
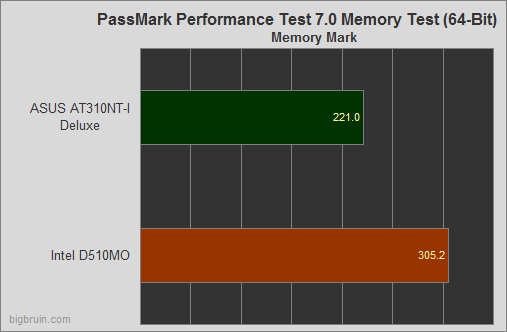
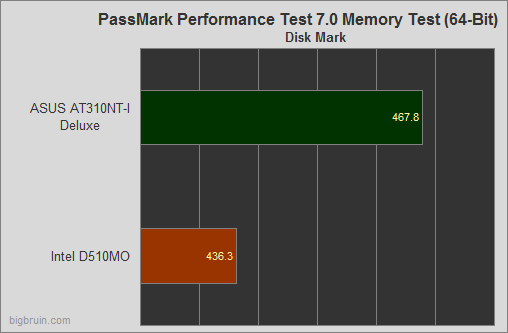
The last two portions of the PassMark benchmark we'll examine are the Memory Mark and Disk Mark. As suspected, the bottleneck of the 533MHz front side bus on the AT310NT-I Deluxe is the real killer here. The shining moment for ASUS is the Disk Mark, even if it is only better by 7%.
