Testing (continued):
HD Tach 3.0.4.0:
The first benchmark executed was
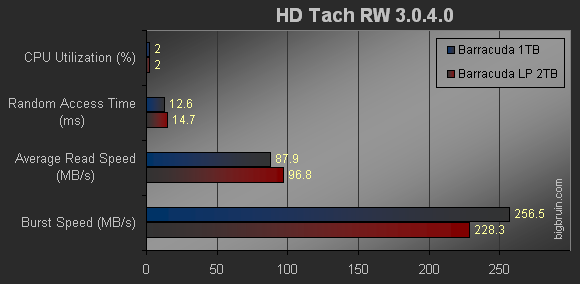
HD Tach 3.0.4.0. This test provides information about the drive being tested, and the graph below details the random access time (ms), the CPU utilization (%), the average read rate (MB/s), and the burst rate (MB/s). Lower values are desirable for random access time and CPU utilization, while higher values are better for average read rate and burst rate.

I am not sure why, but I always like the results from the HD Tach benchmark, I can quickly see how a drive stacks up vs. another. The Barracuda LP drive provides a lower burst, higher random access time, the CPU utilization was the same, and it did have a higher average read speed. This could be viewed as the most important test; considering the 1300RPM difference in rotational speeds the Barracuda LP drive fared rather well.
HD Tune 2.55:
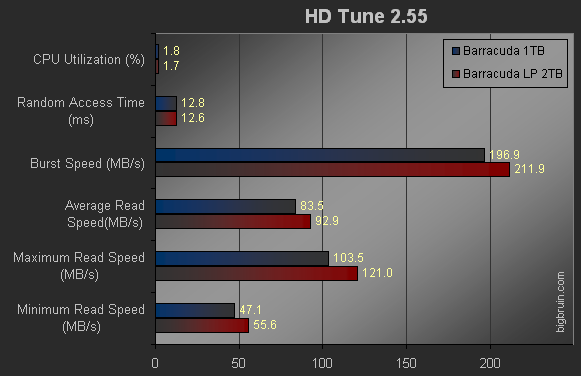
HD Tune 2.55 is another benchmark that tests drive performance, and it is very similar to HD Tach. The graph below details the results for CPU utilization (%), access time (ms), burst rate (MB/s), average read speed (MB/s), maximum read speed (MB/s), minimum read speed (MB/s), where lower values are better for the first two categories and higher values are better for the last four categories.

I was very surprised with the results from the HD Tune test. The Barracuda LP drive came out on top for each benchmark over the higher speed Barracuda 7200.11.