Testing (continued):
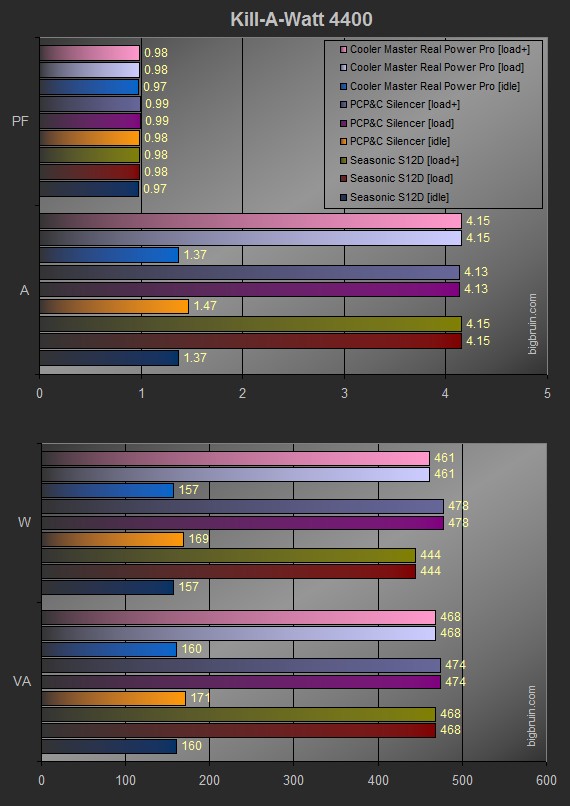
Now we take a look at how the three units compare using our Kill A Watts unit. This time around we have the same idle and load configurations, as well as a load+ configuration. This simply takes the load conditions and adds in a mild overclock on both GPUs and the CPU to up the ante a little bit more.
In the first half of the two pane chart we look at the Power Factor (PF) and Amperage (A). PF is the the ratio of the real power flowing to the load to the apparent power. The closer this number is to 1, the better. We see that all of our units are right around 98%, so that's good. Next up we look and the Amps - both load and idle. The Cooler Master and the Seasonic units both draw 1.37A at rest and 4.15A at full load. We see a bit of fluctuation with the PCP&C unit using less power at load, but more at rest. Again, the fluctuation isn't enough to be of concern here unless one-tenth of an amp is gonna break the bank.

In the second half of the two pane chart we look at the Wattage (W) and the Volt-Amps (VA, or apparent Wattage). In theory, they should be the same. At load, the PCP&C unit draws the most power at 478 Watts while our Seasonic S12D draws the least at 444 watts - a 8% reduction. At rest we have a similar scenario, the PCP&C unit draws the most, and the Seasonic and Cooler Master drawing the least - with the same 8% margin. Volt-Amps tell the same story, as expected. This time the margin is only 2% at load, but 6.5% at rest.